
📓 Gridscript vs Jupyter: When You Want a Notebook and When You Want a Grid
You opened a notebook from three weeks ago, hit ModuleNotFoundError, and spent the next forty minutes fixing an environment instead of looking at your data. Or you got a number, tried to reproduce it, and realised cell 12 had run before cell 7. If you are searching for a Jupyter notebook alternative, it is usually one of those two moments that sent you here, not a dislike of Jupyter itself.
Jupyter is excellent at the thing it was built for. It is just not the only shape a data tool can take.
Short answer: Use Jupyter when you are exploring and the narrative matters: you want a live kernel, prose beside code, and every package on PyPI. Use a grid-first workspace when the shape of the data matters more than the story, when the same cleanup has to run again next week, and when you do not want to install anything to get started.
🔬 When is a Jupyter notebook the right tool?
Reach for Jupyter when the work is genuinely exploratory and you cannot yet describe the steps you will take.
A notebook gives you a kernel: a long-lived Python process that keeps objects in memory between cells. That is the whole point. You load a 400 MB dataframe once, then spend two hours poking at it without paying the load cost again. No other model makes iterative exploration that cheap.
Three other cases where Jupyter clearly wins:
- You need a specific library. Anything on PyPI installs into your kernel. If your work depends on PyTorch, statsmodels, geopandas or an internal package, a local notebook is the honest answer.
- The output is a document. Notebooks interleave markdown, code, and figures. For a teaching artifact, a research writeup, or an analysis someone will read top to bottom, that narrative structure is the deliverable.
- The data cannot leave your machine or your cluster. A local Jupyter server or one running next to your data warehouse keeps everything inside your perimeter.
If you are still learning the ecosystem, our guide to Python for data science covers the libraries you will meet in either tool.
⚠️ What is the main disadvantage of Jupyter notebooks?
Hidden state. The notebook shows you an ordered list of cells, but the kernel remembers the order you actually ran them in, and those two things drift apart within minutes of real work.
Here is the failure in eight lines:
# Cell 1 — load the data
import pandas as pd
df = pd.read_csv("sales.csv")

# Cell 2 — you run this, get a bad result, and edit it
df = df[df["units"] > 0]

# Cell 3 — you edit Cell 2 to > 5 but forget to re-run it,
# then run this. The filter applied is still > 0.
print(len(df))
Nothing errors. You just get a number that does not correspond to the code on screen. Joel Grus made this the centre of his 2018 JupyterCon talk "I Don't Like Notebooks," and it remains the single most-cited criticism of the format.
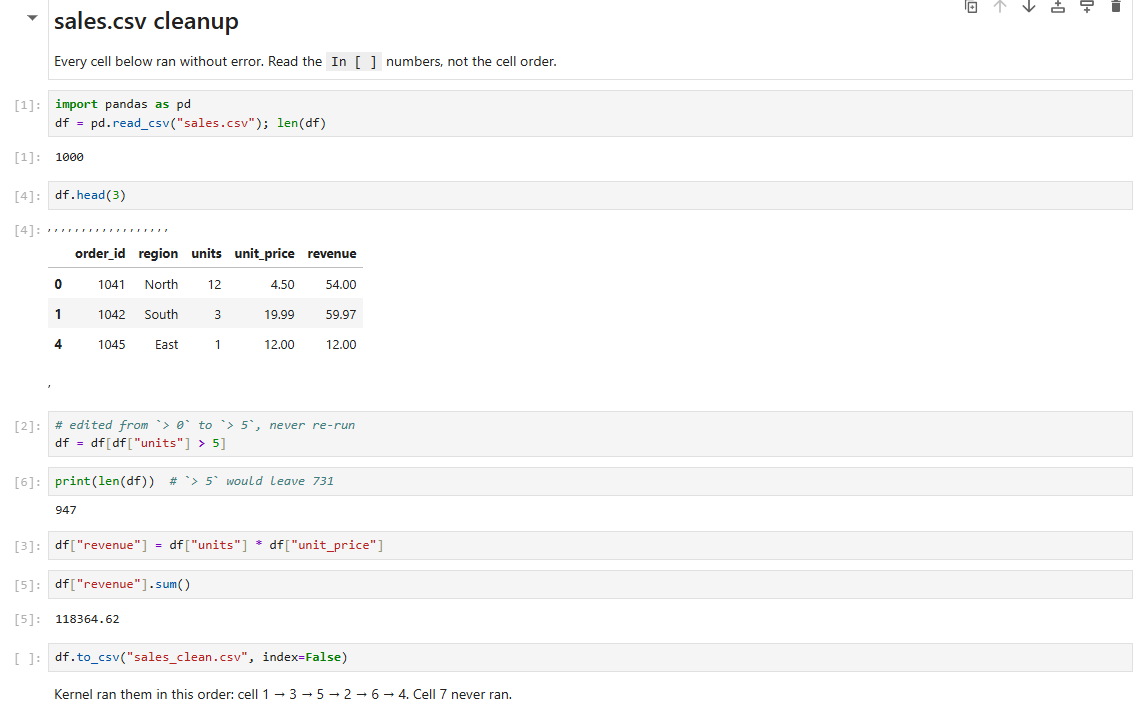
The standard fix is discipline: Restart Kernel and Run All before you trust any result. It works, and almost nobody does it consistently.
Two related costs come with the format:
- Version control is painful. A
.ipynbfile is JSON containing source, outputs, and execution counts. A one-character edit produces a diff full of metadata churn, and two people editing the same notebook produce merge conflicts that are hard to read by hand. Tools likenbdime,nbstripoutandjupytextexist specifically to work around this. - Environment drift. The notebook is not the environment. Without a pinned
requirements.txtor lockfile beside it, "it worked in March" is not a reproducible claim.
📊 When does a grid beat a notebook?
Open a grid when you need to see the data, not a .head() of it.
A notebook renders a truncated table as static output. You cannot sort it, you cannot scroll to row 40,000 to see whether the region column goes blank halfway through the file, and you cannot spot the three rows where someone typed N/A instead of leaving the cell empty. You find those things by looking, and grids are built for looking.
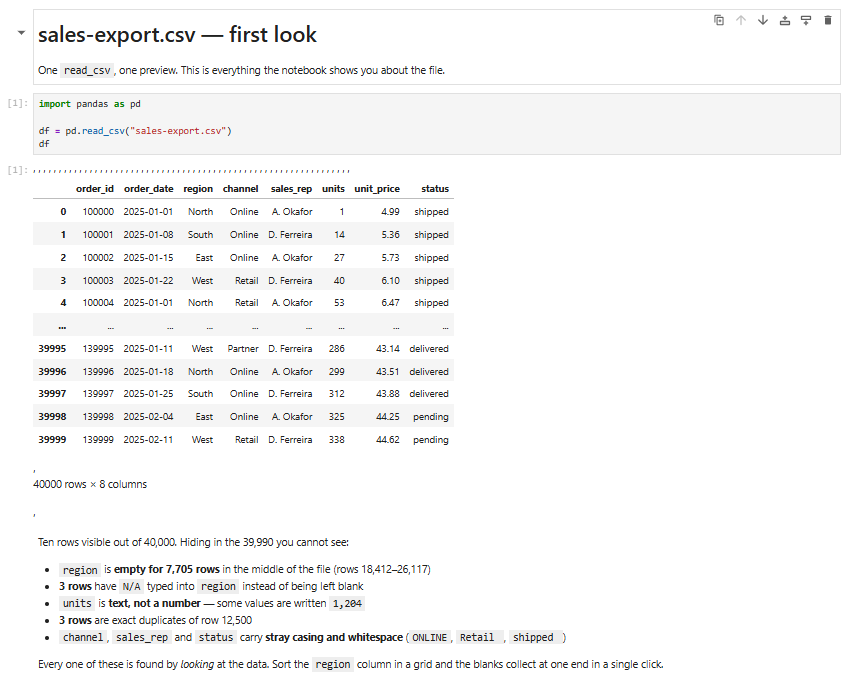
The grid model fits four situations:
- Data cleaning. Most cleanup is discovering problems, not fixing them. Seeing every row makes discovery fast. Our walkthrough of data cleaning and manipulation techniques goes deeper on the actual transformations.
- Repeatable work. When the same file arrives every Monday, you do not want a notebook you have to remember how to run. You want a sequence of named steps.
- Handing work to someone who does not write Python. A colleague can read a list of stages called Import, Filter, Merge, Visualize. They cannot read your notebook.
- You have no environment and do not want one. A laptop with locked-down admin rights, a borrowed machine, a workshop room.
🧭 Notebook or pipeline: which model matches your problem?
The cleanest way to choose is to ask what you are producing.
| Your problem | Notebook | Grid / pipeline |
|---|---|---|
| Shape of the work | A story you write once | A process you run repeatedly |
| Execution model | Any cell, any order, live kernel state | Stages run in sequence, top to bottom |
| Inspecting data | Truncated static output | Every row, sortable, scrollable |
| Setup cost | Install Python, packages, kernel | Open a browser tab |
| Handoff to non-coders | Poor | Good |
| Library access | All of PyPI | numpy, pandas, scikit-learn, TensorFlow.js |
| Reproducibility | Depends on your discipline | Determined by stage order |
| Very large data | Limited by your machine and RAM | Limited by your browser and machine |
That last row is deliberately not a win for either side. Gridscript runs entirely in your browser, so performance depends on your machine and your file size, the same way a local notebook does. Neither is a big-data tool.
🐍 The same cleanup, two ways
Take a sales export with the problems every real export has: inconsistent casing, whitespace, a numeric column read as text, and duplicate rows.
In a Jupyter notebook
import pandas as pd
import io

# Realistic messy export: whitespace, mixed case, a duplicate, a bad number
csv_data = """order_id,region,order_date,units,unit_price
1001, EMEA ,2026-01-04,12,19.99
1002,emea,2026-01-05,8,19.99
1003,APAC,2026-01-05,-3,24.50
1004,AMER,2026-01-06,15,N/A
1002,emea,2026-01-05,8,19.99
1005, apac,2026-01-07,22,24.50
"""

df = pd.read_csv(io.StringIO(csv_data))

# 1. Trim whitespace and normalise casing on the region column
df["region"] = df["region"].str.strip().str.upper()

# 2. Force unit_price to numeric; "N/A" becomes NaN instead of breaking later math
df["unit_price"] = pd.to_numeric(df["unit_price"], errors="coerce")

# 3. Parse dates so you can group by month later
df["order_date"] = pd.to_datetime(df["order_date"])

# 4. Drop exact duplicate rows and impossible quantities
df = df.drop_duplicates()
df = df[df["units"] > 0]

# 5. Derive revenue and summarise
df["revenue"] = df["units"] * df["unit_price"]
summary = df.groupby("region", as_index=False)["revenue"].sum()

print(summary)
Output:
  region  revenue
0   AMER      NaN
1   APAC   539.00
2   EMEA   399.80
The NaN on the AMER row is the point. A missing price silently poisons the total, and you only notice because you printed it. In a grid you would have seen the empty cell before you ever wrote the groupby.
The same logic as pipeline stages
The steps do not change. What changes is that they become named, re-runnable units instead of cells you have to remember the order of:
| Step | Stage type | What it does |
|---|---|---|
| 1 | Import | Load the CSV or .xlsx |
| 2 | Transform | Trim whitespace, uppercase region, coerce unit_price to a number |
| 3 | Validate | Flag rows with a missing price or non-positive units |
| 4 | Filter | Remove the flagged rows |
| 5 | Transform | Add the revenue column |
| 6 | Visualize | Bar chart of revenue by region |
Next Monday, you point stage 1 at the new file and run the pipeline. There is no cell order to get wrong.
🚀 Do this in Gridscript
Here is the whole workflow with no install. It takes about five minutes.
Step 1. Open a pipeline. Go to Gridscript pipelines. No signup, no environment. Your data stays in your browser.
Step 2. Add an Import stage. Point it at your CSV, Excel file, or JSON. Give the dataset a target name like sales so later stages can reference it.
Step 3. Add a Transform stage. Use the no-code controls for the trimming, casing and type coercion. You can see every row change as you go, which is the part a notebook cannot give you.
Step 4. Add a Validate stage. Catch the missing unit_price before it turns into a NaN three steps downstream.
Step 5. Add a Filter stage. Drop the invalid rows.
Step 6. Drop in a code stage where the no-code tools run out. Pipeline stages share a common context object, so a Python stage can pick up where a no-code stage left off, and a JavaScript stage after it can pick up from there. Use pandas, numpy or scikit-learn in Python; TensorFlow.js in JavaScript.
# Python stage: derive revenue and summarise by region.
# Check /docs/pipelines/ for the exact context object reference.
df["revenue"] = df["units"] * df["unit_price"]
summary = df.groupby("region", as_index=False)["revenue"].sum()
Step 7. Add a Visualize stage. Bar, line, scatter, pie and donut charts are built in. No matplotlib import, no figure sizing, no backend configuration. If you want to understand the charting concepts more deeply, our piece on data visualization in Python covers what each chart type is actually for.
Step 8. Export. Save the pipeline as a .gspp file, or the project as .gspj, with the scripts and history included. Or export the cleaned result straight to CSV, Excel or JSON.
The .gspp file is the part worth pausing on. It is the pipeline, not just the output, which means next month's version of this job is a file you open rather than a notebook you re-derive. The pipelines documentation covers every stage type in detail, and the projects documentation explains the difference if you want a single-analysis workspace instead.
Gridscript is free during public beta.
🧰 Common mistakes and how to fix them
"It worked last month and now it errors." Almost always environment drift, not your code. Pin your dependencies in a requirements.txt next to the notebook, and note the Python version. If you cannot reproduce the environment, you cannot reproduce the result.
ModuleNotFoundError right after you pip installed the package. You installed into a different environment than the kernel is using. Inside the notebook, use %pip install packagename rather than !pip install; the magic command installs into the kernel's own environment.
A result you cannot reproduce. Restart the kernel and run all cells before trusting any number you are going to share. If the result changes, the notebook was lying to you about its own state.
Unreadable .ipynb diffs in git. Strip outputs before committing with nbstripout, or keep a paired plain-text .py version using jupytext. Both are standard fixes for the JSON-diff problem.
A large file making the browser sluggish. Filter and select columns as early in the pipeline as you can, so later stages carry less data. Gridscript runs on your machine, so a file that would strain a local notebook will strain a browser tab too. Sample first, then scale up.
❓ FAQ
What is the main disadvantage of Jupyter notebooks? Hidden state. Cells can be run in any order, and the kernel remembers that order rather than the order shown on screen. Editing a cell without re-running it leaves the displayed code out of sync with the result below it. The fix is restarting the kernel and running all cells before trusting any output.
Can you run Python in a browser without installing anything? Yes. Browser-based data workspaces run Python without a local install or server. Gridscript gives you numpy, pandas and scikit-learn in Python stages and TensorFlow.js in JavaScript stages, with your data staying in the browser. You will not get every PyPI package, so check your dependencies first.
Is Jupyter good for data cleaning? It is workable but not ideal. Cleaning is mostly about spotting problems, and a notebook shows you a truncated preview rather than the full table. A grid lets you sort, scroll and see the blank or malformed cells directly. Notebooks are better suited to exploration and modelling than to inspection.
What is the difference between a notebook and a data pipeline? A notebook is a document you execute interactively, cell by cell, in whatever order you choose. A pipeline is an ordered sequence of named stages that runs the same way every time. Notebooks suit one-off exploration; pipelines suit work that repeats, because the step order is part of the artifact.
Why are Jupyter notebooks hard to version control?
A .ipynb file is JSON containing source code, cell outputs, and execution counts. Small edits generate large, noisy diffs, and simultaneous edits cause merge conflicts that are difficult to resolve by hand. Tools such as nbstripout, nbdime and jupytext exist to make notebook diffs readable.
📌 Summary
| Term | What it means |
|---|---|
| Kernel | The live Python process a notebook keeps in memory between cells |
| Hidden state | Results that depend on the order cells were run, not the order shown |
| Project | A Gridscript workspace unit holding tables, transformations, charts and scripts for one analysis |
| Pipeline | An ordered sequence of stages that processes data the same way every run |
| Stage | One step in a pipeline: Import, Transform, Filter, Sort, Merge, Path, Visualize, Validate, or a code stage |
| Context object | The shared state pipeline stages pass data through, letting JavaScript and Python stages mix |
.gspp / .gspj | Exported pipeline and project files, including scripts and history |
Keep Jupyter for the exploring. For the cleanup that has to run again next month, build it as a pipeline in your browser, free, with nothing to install.